Statistics
STATISTICS
Pagina 2 van de 384 resultaten
Sorteer op

-
Elementary Statistics Questions and Answers 100% Correct
- Tentamen (uitwerkingen) • 62 pagina's • 2023
- $12.99
- + meer info
Identify whether the statement describes inferential statistics or descriptive statistics. There is a relationship between smoking cigarettes and getting emphysema. - ANSWER-inferential statistics From past figures, it is predicted that 19% of the registered voters in California will vote in the June primary. - ANSWER-descriptive statistics Determine whether the data are qualitative or quantitative. the number of seats in a movie theater - ANSWER-quantitative Identify the data set...
-
Instructor Manual for Statistics A Tool for Social Research and Data Analysis 11th Edition Joseph F. HealeyChristopher Donoghue
- Overig • 16 pagina's • 2024
- $18.99
- + meer info
Instructor Manual for Statistics A Tool for Social Research and Data Analysis 11th Edition Joseph F. HealeyChristopher Donoghue

-
STA 2024 Final Exam (Statistics Review) Rated 100% Correct!!
- Tentamen (uitwerkingen) • 11 pagina's • 2024
- $13.99
- + meer info
STA 2024 Final Exam (Statistics Review) Rated 100% Correct!!
-
Statistics Midterm Exam Questions and Answers Latest 2022 Already Passed
- Tentamen (uitwerkingen) • 26 pagina's • 2022
- $13.99
- 3x verkocht
- + meer info
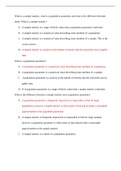
What is a sample statistic, what is a population parameter, and what is the difference between them? What is a sample statistic? A. A sample statistic is a range of likely values that a population parameter could take. B. A sample statistic is a numerical value describing some attribute of a population. C. A sample statistic is a numerical value describing some attribute of a sample. This is the correct answer D. A sample statistic is a portion of the entities of interest that the research...

-
Statistics Final Exam 2024 Questions and Correct Answers
- Tentamen (uitwerkingen) • 11 pagina's • 2024
- $11.99
- + meer info
Statistics Final Exam 2024 Questions and Correct Answers

Fear of missing out? Hoeft niet!


-
STATISTICS FINAL EXAM STUDY GUIDE QUESTIONS & ANSWERS SOLVED TO PASS 100%
- Tentamen (uitwerkingen) • 9 pagina's • 2024
- $13.99
- + meer info
STATISTICS FINAL EXAM STUDY GUIDE QUESTIONS & ANSWERS SOLVED TO PASS 100%

-
STATISTICS EXAM ONE CHAPTER 1-4
- Tentamen (uitwerkingen) • 8 pagina's • 2023
- $10.99
- + meer info
The general process of gathering, organizing, summarizing, analyzing, and interpreting data to assist in making effective decisions is called: a. statistics b. descriptive statistics c. inferential statistics d. levels of measurement - Answer- a A sample is: a. at least 15 observations b. a group of people c. part of a population d. a set of frequencies - Answer- c The main purpose of inferential statistics is to: a. summarize data in a useful and informative manner b. estimate...

-
Statistics Chapter 3 Homework Questions and Answers 100% Pass
- Tentamen (uitwerkingen) • 69 pagina's • 2024
- $15.49
- + meer info
3.1 A histogram of a set of data indicates that the distribution of the data is skewed right. Which measure of central tendency will likely be larger, the mean or the median? Why? Choose the correct answer below. A. The mean will likely be larger because the extreme values in the left tail tend to pull the mean in the opposite direction of the tail. B. The median will likely be larger because the extreme values in the right tail tend to pull the median in the direction of the tail. C. ...
-
Solutions Manual to accompany STATISTICS FOR ENGINEERS AND SCIENTISTS Fourth Edition by William Navidi
- Tentamen (uitwerkingen) • 279 pagina's • 2023
- $25.99
- + meer info
Solutions Manual to accompany STATISTICS FOR ENGINEERS AND SCIENTISTS Fourth Edition by William Navidi

-
Statistics Exam 1 Review
- Overig • 7 pagina's • 2023
- $10.99
- + meer info
Descriptive Statistics - Answer- collection, organization, presentation, and summary of data Inferential Statistics - Answer- generalizing from a sample to a population, drawing conclusions, and making decisions Categorical/Qualitative Data - Answer- consists of values that can be expressed in words may be coded arbitrarily with the help of numbers, but have categorical meaning Numerical/Quantitative Data - Answer- arises from counting, measuring, or some mathematical operation Disc...
