Tentamen (uitwerkingen)
final_Exam.pdf
- Instelling
- Boston University
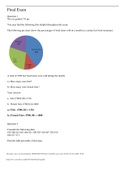
You may find the following files helpful throughout the exam: The following pie chart shows the percentages of total items sold in a month in a certain fast food restaurant. A total of 4700 fast food items were sold during the month. a.) How many were fish? b.) How many were french fri...
[Meer zien]